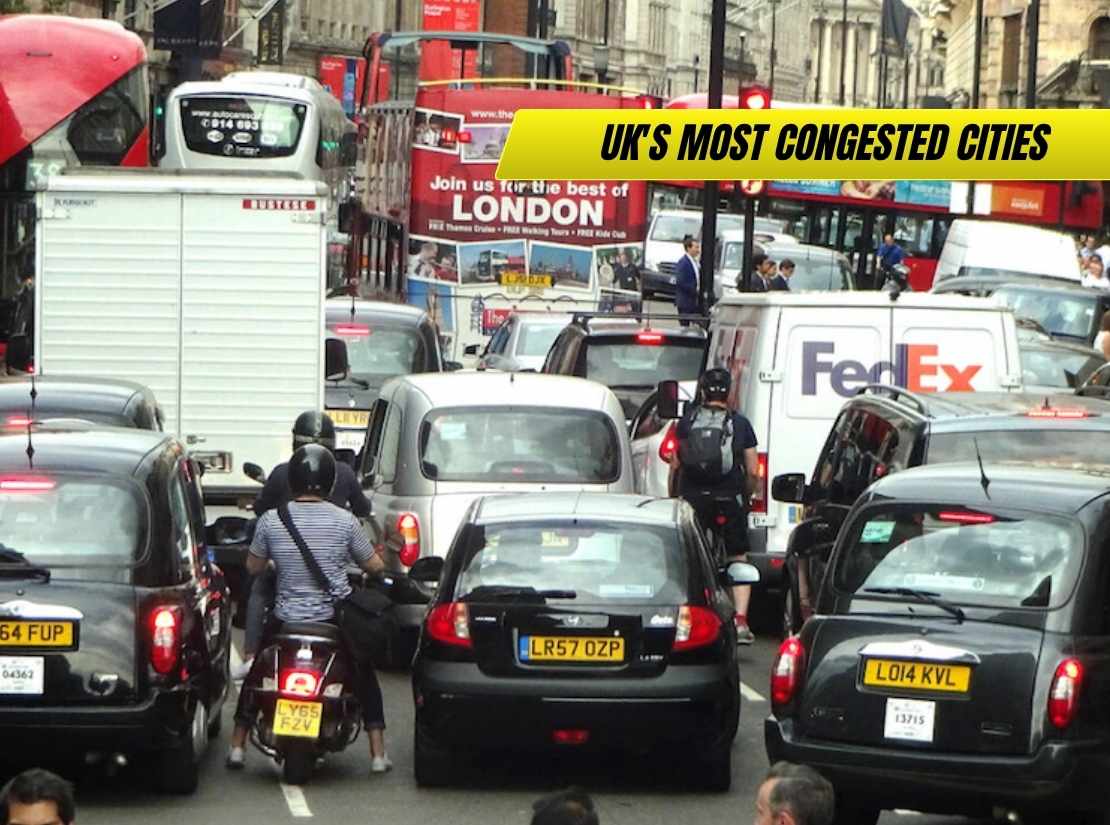
Comprehensive analysis of the UK’s most congested cities based on INRIX 2024 data. Discover which British cities have the worst traffic, costs to drivers, and practical strategies for avoiding delays.
Traffic congestion has become an inescapable reality for millions of British drivers, with the latest INRIX Global Traffic Scorecard revealing that UK motorists collectively lost 62 hours each to traffic delays in 2024. This represents not just wasted time, but a significant economic burden that’s reshaping how we live, work, and travel across Britain’s increasingly crowded urban areas.
According to our analysis at AutoHit, understanding regional congestion patterns has become essential for UK drivers making decisions about everything from daily commuting routes to where to live and work. The INRIX 2024 data shows London maintaining its position as Europe’s most congested city, but perhaps more concerning is the rapid rise of congestion in cities outside the capital, with Manchester seeing a 13% year-on-year increase in delays.
The reality is that congestion costs extend far beyond the frustration of sitting in traffic. British drivers collectively lost £7.7 billion to traffic delays in 2024, with individual costs ranging from hundreds to over £900 per driver annually depending on location. These figures don’t include additional fuel costs, vehicle wear, or the hidden health and lifestyle impacts of extended commuting times that affect millions of UK families.
Key Highlights:
- London Dominance: The capital accounts for approximately 50% of all UK traffic delays, with drivers losing 101 hours annually at an average cost of £942 per driver
- Regional Growth: Manchester has rapidly risen to become the UK’s 4th most congested city, jumping from 11th place in 2022 through dramatic year-on-year increases
- Economic Impact: UK congestion costs reached £7.7 billion in 2024, representing £581 per driver annually with London bearing the highest individual burden
- Peak Corridors: London’s A40 Westway remains the UK’s most congested road, with 5-6pm being the worst period for delays nationwide
- Emerging Hotspots: Sheffield and Edinburgh entered the top 10 most congested UK cities for the first time in 2024, reflecting urban growth and infrastructure pressures
- Recovery Trend: Most UK cities show traffic levels returning to or exceeding pre-pandemic patterns as office work and urban activity resume
London: Europe’s Congestion Capital
London’s position as Europe’s most congested city reflects both its economic success and infrastructure limitations, with 4 million drivers collectively losing over 400,000 years worth of time annually to traffic delays. The capital’s 101 hours of average delay per driver represents a 2% increase from 2023, continuing a concerning upward trend from 97 hours in 2022.
The economic impact on London is staggering, with total costs reaching £3.85 billion in 2024, averaging £942 per driver. These figures only capture direct time costs and don’t include additional fuel consumption, vehicle wear, or productivity losses from delayed arrivals and stressed employees.
Central London’s medieval street pattern, combined with modern traffic volumes, creates bottlenecks that ripple across the entire metropolitan area. The concentration of employment, economic activity, and population density means that minor disruptions can cascade into major delays affecting hundreds of thousands of commuters.
London’s Worst Traffic Corridors
The A40 Westway between the North Circular and the A406 holds the dubious honour of being the UK’s most congested corridor, with drivers facing an additional 17 minutes during the 5pm peak hour. This translates to 68 hours of wasted time annually for regular users, highlighting how specific route choices can dramatically impact individual experiences of London traffic.
The M25’s notorious congestion continues to affect orbital traffic, with ongoing roadworks at the Wisley interchange and M3 junction creating cascading delays throughout the southwest London area. These infrastructure projects, while necessary for long-term improvement, demonstrate how construction work can temporarily worsen already challenging conditions.
North London corridors including the A1, A404, and A501 consistently rank among the worst for delays, reflecting the historic development patterns that concentrate employment in central areas while pushing residential development to outer zones. This mismatch between jobs and housing creates predictable but severe rush hour congestion.
The Rise of Regional Congestion
Perhaps the most significant finding from the 2024 INRIX data is the rapid increase in congestion outside London, with Manchester leading this concerning trend through a 13% year-on-year increase. This shift reflects broader economic and social changes as regional cities attract investment and population growth previously concentrated in the capital.
Manchester’s rise from 11th place nationally in 2022 to 4th place in 2024 represents one of the most dramatic congestion increases recorded in any UK city. This surge correlates with major infrastructure development, population growth, and the city’s increasing role as a northern economic centre competing with London for business and talent.
Bristol and Leeds both moved up the congestion rankings, while Birmingham and Wigan saw their positions fall. These changes reflect the dynamic nature of UK urban development and highlight how local economic conditions, infrastructure investment, and population movements create shifting congestion patterns across the country.
Emerging Urban Pressure Points
Sheffield and Edinburgh’s entry into the top 10 most congested UK cities marks a significant shift in the national traffic landscape. Both cities experienced 53 hours of annual delay per driver, representing new pressure points in the UK’s transport network.
Sheffield’s inclusion reflects the Steel City’s economic renaissance and growing role as a regional centre, with increased employment and development creating traffic patterns that the existing road network struggles to accommodate. Similarly, Edinburgh’s position reflects both tourism pressures and its role as Scotland’s economic and political centre.
These emerging hotspots suggest that congestion is becoming a nationwide issue rather than primarily a London problem, with regional cities experiencing rapid growth that outpaces transport infrastructure development.
Economic Impact and Driver Costs
The £7.7 billion annual cost of UK traffic congestion represents a significant economic burden that affects everything from business competitiveness to household budgets. This figure reflects only direct time costs based on lost productivity, with additional impacts including increased fuel consumption, vehicle maintenance, and environmental costs.
Individual driver costs vary dramatically based on location and travel patterns, ranging from relatively modest impacts in smaller cities to over £900 annually for London drivers. These costs disproportionately affect lower-income households who often face longer commutes due to housing costs pushing them to more affordable but distant areas.
The economic ripple effects extend beyond individual drivers to affect business operations, supply chains, and regional competitiveness. Companies face higher transport costs, reduced employee productivity, and difficulty attracting talent unwilling to accept lengthy commutes.
Hidden Costs and Quality of Life
Beyond direct financial impacts, traffic congestion affects health, family life, and general wellbeing through extended commuting times that reduce time available for exercise, social activities, and family relationships. Studies consistently show correlations between long commutes and increased stress, reduced life satisfaction, and health problems.
The environmental costs of congestion include increased emissions from vehicles operating inefficiently in stop-start traffic, contributing to air quality problems in urban areas already struggling with pollution levels. These environmental impacts create additional health costs and affect quality of life for all urban residents.
Housing market distortions result from congestion patterns, with areas offering good transport connections commanding premium prices while locations with poor connections become less desirable despite potentially offering better value or amenities.
UK’s Most Congested Cities: Complete Rankings
Based on the latest INRIX 2024 Global Traffic Scorecard data, here are the UK’s most congested urban areas ranked by hours lost per driver annually:
1. London – 101 hours The capital maintains its position as Europe’s most congested city, with delays costing each driver £942 annually. The concentration of employment and economic activity creates persistent bottlenecks despite extensive public transport options.
2. Bristol – 68 hours Bristol’s position reflects its role as a major southwestern economic centre, with limited alternative routes creating chokepoints during peak periods. The M4/M5 junction and city centre access routes contribute significantly to delays.
3. Leeds – 61 hours West Yorkshire’s largest city continues to experience significant congestion as its economy grows and attracts more commuters from across the region. Limited ring road capacity exacerbates central area congestion.
4. Manchester – 59 hours Despite ranking 4th by hours lost, Manchester showed the highest year-on-year increase at 13%, reflecting rapid economic growth and infrastructure pressures. The city’s expanding role as a northern powerhouse creates new traffic patterns.
5. Birmingham – 58 hours The UK’s second city sees persistent congestion around major junctions, particularly affecting the A38 and ring road connections. Ongoing infrastructure projects aim to address long-term capacity issues.
Mid-Tier Urban Congestion
6. Wigan – 56 hours Greater Manchester’s connectivity to the motorway network creates through-traffic issues that compound local congestion patterns.
7. Bradford – 54 hours West Yorkshire’s textile heritage city experiences congestion particularly affecting routes to Leeds and Manchester.
8. Sheffield – 53 hours New entrant to the top 10, reflecting the Steel City’s economic renaissance and growing regional importance.
9. Edinburgh – 53 hours Scotland’s capital faces unique challenges combining tourist traffic, political activity, and economic growth within historic street patterns.
10. Coventry – 53 hours Midlands connectivity and proximity to Birmingham create complex traffic flows affecting local journey times.
Regional Variations and Patterns
Congestion patterns across the UK reflect broader economic and demographic trends, with growth in regional cities creating new pressure points while traditional industrial areas see varying impacts. The data reveals that congestion increasingly follows economic activity rather than simple population density.
Northern England shows particular growth in congestion levels, reflecting the success of government policies promoting northern economic development but highlighting infrastructure inadequacies. Cities like Manchester and Leeds demonstrate that economic success and traffic congestion often develop in parallel.
Scotland’s representation through Edinburgh reflects the concentration of economic activity in the central belt, while the absence of Glasgow from the top rankings suggests different urban development patterns or more effective traffic management strategies.
Motorway and Strategic Route Impact
The UK’s strategic road network significantly influences local congestion patterns, with cities located at major motorway junctions often experiencing disproportionate impacts from through-traffic. The M25’s orbital effects on London congestion demonstrate how strategic infrastructure can both alleviate and concentrate traffic problems.
Regional variations in motorway capacity and alternative route availability create different congestion characteristics across the country. Areas with limited alternative routes, such as southwestern approaches to London or trans-Pennine corridors, show more severe impacts from any disruption.
Future infrastructure developments, including smart motorway rollouts and major capacity improvements, will likely reshape these patterns, though current evidence suggests that increased capacity often generates additional traffic rather than reducing congestion.
Practical Strategies for UK Drivers
Understanding national congestion patterns helps drivers make informed decisions about route planning, timing, and even life choices about where to live and work. The data provides actionable insights for reducing personal exposure to traffic delays while understanding the broader patterns affecting journey planning.
Flexible working arrangements have become increasingly important for managing congestion exposure, with data showing that slight adjustments to departure times can significantly reduce journey delays. Peak congestion typically occurs between 5-6pm nationally, suggesting that even 30-minute schedule adjustments can provide substantial time savings.
Technology solutions including real-time traffic apps and route optimization systems become more valuable in highly congested areas, though their effectiveness varies significantly between cities and specific corridors.
Long-term Planning Considerations
For drivers considering relocation or job changes, understanding regional congestion trends provides valuable context for evaluating total cost of living and quality of life impacts. A lower-cost housing area may prove expensive if it requires lengthy commutes through congested corridors.
Vehicle choice considerations become more important in high-congestion areas, with hybrid and electric vehicles offering both efficiency benefits during stop-start driving and potential access advantages through low emission zones.
Public transport integration varies dramatically between UK cities, with some offering genuine alternatives to driving while others provide limited options for avoiding road-based commuting. Understanding local transport ecosystems helps inform both short-term journey planning and longer-term location decisions.
| City | Hours Lost | Cost Per Driver | Key Corridors | Trend | Our Take |
|---|---|---|---|---|---|
| London | 101 | £942 | A40, M25, A404 | +2% | Persistent European leader |
| Bristol | 68 | £640 | M4/M5 junction | Stable | Regional bottleneck issues |
| Leeds | 61 | £574 | A1, Ring Road | +1 position | Northern growth centre |
| Manchester | 59 | £554 | M60, A34 | +13% | Fastest deteriorating |
| Birmingham | 58 | £545 | A38, Ring Road | -1 position | Improvement efforts showing |
Infrastructure and Policy Responses
Government and local authority responses to congestion vary significantly across the UK, with some cities implementing comprehensive traffic management strategies while others rely primarily on traditional capacity expansion. The effectiveness of different approaches provides lessons for other areas facing similar challenges.
London’s congestion charge and ULEZ demonstrate how pricing mechanisms can influence traffic patterns, though their effectiveness depends on viable alternatives and appropriate exemptions. Similar schemes in other UK cities have shown mixed results, suggesting that local conditions significantly affect policy success.
Investment in public transport infrastructure shows strong correlation with congestion management success, though the relationship isn’t always immediate due to the time required for behavioral change and network effects to develop.
Smart Infrastructure Development
Intelligent traffic management systems are being deployed across UK cities with varying levels of sophistication and success. Real-time signal optimization, dynamic routing, and integrated transport information systems show promise for improving existing infrastructure efficiency.
However, technology solutions require substantial ongoing investment and coordination between multiple agencies and systems. The most successful implementations combine technical innovation with comprehensive transport planning and user education.
Future developments including connected vehicle technology and autonomous driving capabilities may fundamentally alter congestion patterns, though current planning must address immediate problems while preparing for longer-term technological changes.
Future Trends and Predictions
The trajectory of UK congestion suggests continued pressure on urban transport systems as economic activity concentrates in successful cities while housing costs push commuters to more distant locations. This pattern appears likely to continue unless addressed through comprehensive transport and planning policies.
Remote and hybrid working practices, accelerated by the pandemic, may provide some relief from peak period congestion, though current evidence suggests that traffic levels are returning toward or exceeding pre-pandemic patterns in most areas.
Climate change policies including net-zero commitments will increasingly influence transport planning, potentially creating tension between congestion relief and environmental objectives unless carefully coordinated.
Regional Rebalancing Effects
Government policies promoting regional economic development may help redistribute growth away from the most congested areas, though successful regional cities risk developing their own congestion problems as Manchester’s recent experience demonstrates.
Infrastructure investment including HS2, Northern Powerhouse Rail, and strategic road improvements may reshape congestion patterns, though these projects also risk generating additional traffic that offsets capacity improvements.
The long-term trend toward urbanization suggests that effective congestion management will become increasingly important for UK economic competitiveness and quality of life, requiring sustained investment and policy coordination across multiple levels of government.
Frequently Asked Questions
How accurate are the INRIX congestion figures for planning my daily commute?
INRIX data represents average annual conditions across entire urban areas, so individual route experiences will vary significantly. The figures provide useful context for understanding relative congestion levels between cities, but specific corridors and times can be much better or worse than the averages suggest. For daily planning, real-time traffic apps using current conditions typically provide more actionable information than annual averages.
Why has Manchester’s congestion increased so dramatically compared to other UK cities?
Manchester’s 13% year-on-year increase reflects its rapid economic growth and rising prominence as a northern business centre. Major infrastructure projects, population growth, and increased employment have created new traffic patterns that existing road networks struggle to accommodate. The city’s success in attracting investment and residents has outpaced transport infrastructure development, creating a classic growth versus capacity mismatch.
Are these congestion costs worth it compared to moving away from major cities?
This depends heavily on individual circumstances including salary levels, career opportunities, and lifestyle preferences. While congestion costs in London average £942 annually, salaries and career prospects often justify these expenses. However, the calculation becomes more complex when including housing costs, stress levels, and family considerations. Many people find optimal solutions through flexible working, public transport use, or choosing locations with good transport links rather than complete relocation.
How do UK congestion levels compare internationally?
London ranks 5th globally for congestion, behind Istanbul, New York, Chicago, and ahead of Paris. UK cities generally experience moderate congestion compared to rapidly growing cities in developing countries or historic European centres with medieval street patterns. However, the economic impact per driver in the UK is higher due to elevated labour costs and living standards, making British congestion particularly expensive even when hours lost are moderate by international standards.
What’s the most effective way to avoid congestion in UK cities?
The most effective strategies combine multiple approaches: flexible working hours to avoid peak periods, using public transport where viable, choosing residential locations with good transport links, and utilizing real-time traffic information for route optimization. For urban driving, hybrid vehicles can reduce fuel costs during stop-start conditions while potentially providing access benefits in low emission zones.
Will remote working permanently reduce UK traffic congestion?
Current evidence suggests remote working provides some relief but hasn’t fundamentally altered traffic patterns. Most UK cities are seeing congestion return toward pre-pandemic levels as businesses encourage office returns and urban activities resume. Hybrid working may provide ongoing benefits by reducing peak period concentration, but the overall trend suggests that traffic volumes will continue growing with economic activity.
Which UK cities are best for avoiding serious traffic congestion?
Cities notably absent from the top congestion rankings include Newcastle, Norwich, Plymouth, and many Scottish cities outside Edinburgh. However, lower congestion often correlates with fewer economic opportunities, so the choice involves balancing career prospects against quality of life factors. Some cities like Glasgow manage to combine significant economic activity with relatively manageable traffic levels through effective planning and public transport investment.
Conclusion
The UK’s traffic congestion landscape reflects the complex interplay between economic success, population growth, and infrastructure capacity that defines modern British urban life. While London’s dominance as Europe’s most congested city continues, the rapid rise of regional centres like Manchester demonstrates that traffic problems increasingly affect the entire nation rather than just the capital.
The economic cost of £7.7 billion annually represents more than just inconvenience – it’s a significant drag on productivity and quality of life that affects millions of UK families. Understanding these patterns helps drivers make informed decisions about everything from daily route planning to major life choices about where to live and work.
Perhaps the most concerning trend is the rapid deterioration in regional cities that had previously managed growth without severe congestion problems. Manchester’s 13% year-on-year increase demonstrates how quickly successful economic development can overwhelm transport infrastructure, creating challenges that require years of investment to address.
For UK drivers, the key insight is that congestion increasingly requires strategic thinking rather than just tactical route planning. Whether you’re navigating London’s persistent delays, Manchester’s rapid deterioration, or the emerging pressures in cities like Sheffield and Edinburgh, understanding these patterns helps optimize both immediate journey planning and longer-term life decisions.
Looking ahead, the challenge for UK transport policy is managing the tension between economic success and liveable cities. The data suggests that without sustained investment in transport infrastructure and innovative approaches to urban mobility, Britain’s economic success risks being undermined by the very congestion it creates.
Comprehensive analysis of the UK’s most congested cities based on INRIX 2024 data. Discover which British cities have the worst traffic, costs to drivers, and practical strategies for avoiding delays.