Electric cars are often described as “zero-emission,” but in 2025 that statement only tells half the story. While EVs emit no exhaust gases, their total carbon footprint depends on battery production, energy sources, and driving habits. This guide separates fact from fiction for UK drivers comparing electric and petrol vehicles under the current UK energy mix and lifecycle emissions data.
Key Points
- EVs emit zero tailpipe CO₂, but production adds 30–40% more emissions upfront.
- Average UK EV emits 60–70 g/km CO₂ equivalent, versus 160 g/km for petrol.
- Lifetime emissions depend on battery size, mileage, and electricity source.
- Charging with renewable tariffs can cut total footprint by up to 50%.
- EVs meet all ULEZ and zero road tax criteria through 2025.
Tailpipe vs Lifecycle Emissions
A petrol car burns about 2.3 kg of CO₂ per litre of fuel.
An electric car produces no exhaust CO₂, but emissions arise from:
- Battery mining and assembly (lithium, nickel, cobalt).
- Electricity generation for charging.
- Manufacturing and logistics.
Lifecycle analysis includes cradle-to-grave impact — from raw materials to recycling.
Average CO₂ Comparison (UK 2025)
| Vehicle Type | Tailpipe Emissions | Lifecycle CO₂ (g/km) | Notes |
|---|---|---|---|
| Petrol (supermini) | 160 | 180 | 50 mpg average |
| Diesel | 140 | 170 | Better efficiency, higher NOx |
| Hybrid (HEV) | 90 | 120 | Partial electrification |
| Plug-in Hybrid (PHEV) | 40 | 100 | Depends on charging frequency |
| Battery Electric Vehicle (BEV) | 0 | 65 | UK energy mix 2025 |
| BEV (Renewable Tariff) | 0 | 35 | Using 100% green electricity |
Based on SMMT 2025 data and National Grid Zero Carbon analysis.
The Impact of Battery Manufacturing
Battery production accounts for up to 35% of an EV’s lifecycle emissions.
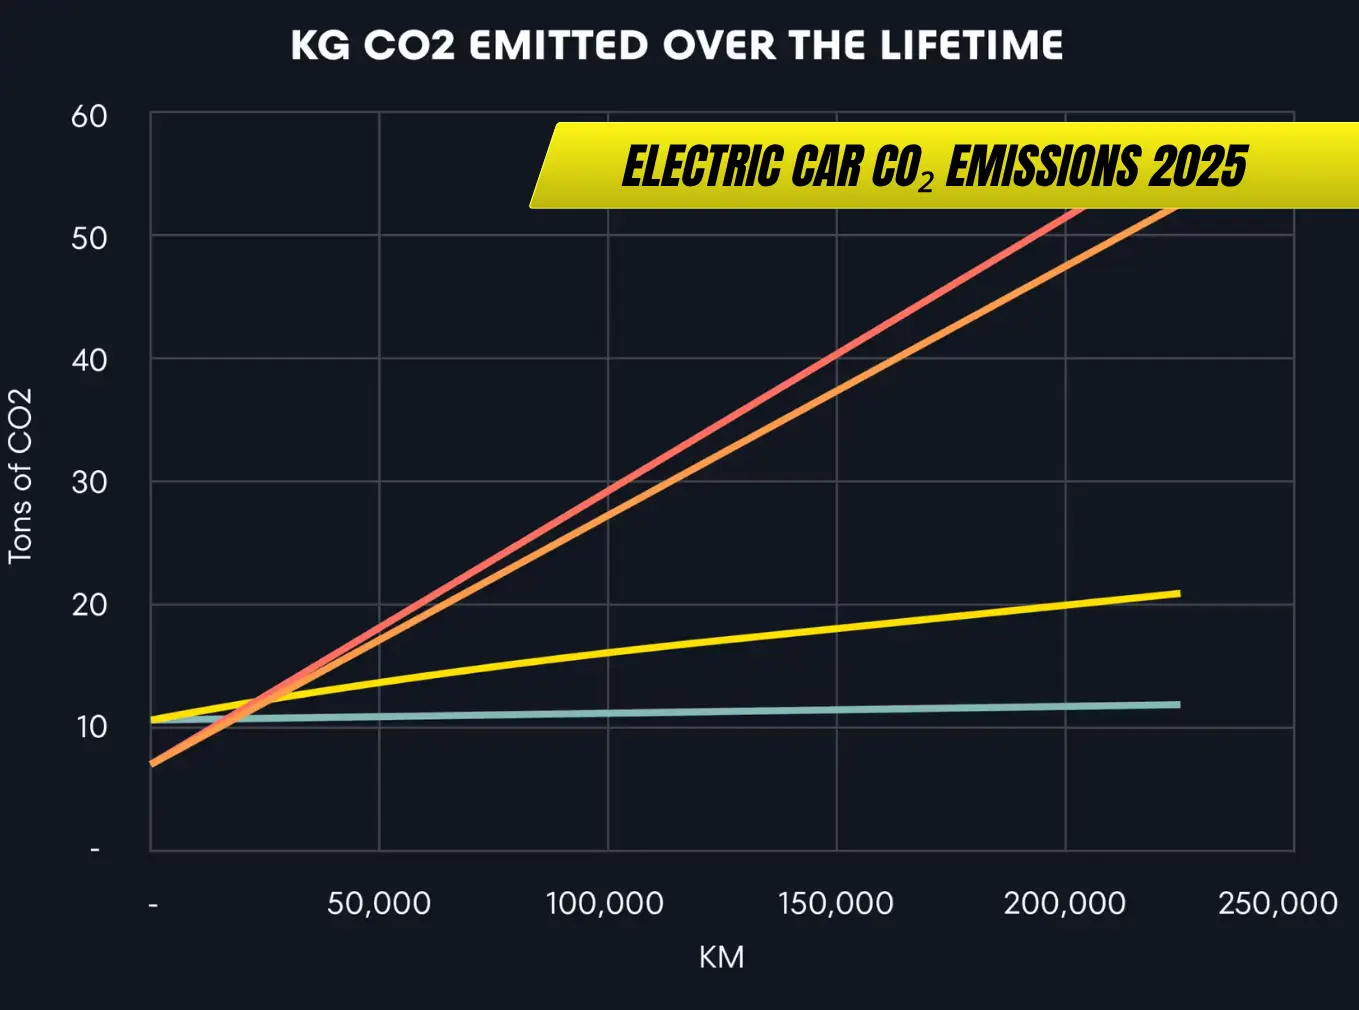
A typical 60 kWh pack adds 5–8 tonnes of CO₂ before the vehicle is even driven.
However, after 20,000–25,000 miles, an EV’s total footprint becomes lower than a petrol car — the “carbon break-even point”.
Battery recycling now recovers up to 95% of materials through UK facilities operated by companies like Recyclus Group and Lithium Loop.
UK Electricity Mix and its Effect
In 2025, UK electricity generation consists of:
- 52% renewables (wind, solar, hydro).
- 33% natural gas.
- 15% nuclear and imports.
Each kWh of UK grid power emits about 120 g CO₂, down from 350 g in 2015.
Charging with green energy suppliers such as Octopus Energy or OVO Energy further reduces total emissions.
Example: EV vs Petrol Hatchback (Full Lifecycle)
| Factor | Electric (Peugeot e-208) | Petrol (Peugeot 208 1.2) |
|---|---|---|
| Manufacturing CO₂ | 8.5 t | 6.0 t |
| Use-phase CO₂ per km | 0.06 kg | 0.16 kg |
| Lifetime (150,000 km) | 17.5 t | 30 t |
| CO₂ Reduction | −42% | — |
Result: The EV breaks even after 25,000 km and emits 12.5 tonnes less over its lifespan.
Home vs Public Charging Impact
| Source | CO₂ Intensity (2025) | Notes |
|---|---|---|
| Home (renewable tariff) | 40 g/kWh | Lowest impact |
| Public fast charger (grid mix) | 110 g/kWh | Average |
| Motorway ultra-rapid | 140 g/kWh | Uses backup diesel generation in peaks |
Charging off-peak at home is both cheaper and greener.
Night charging coincides with higher renewable grid input from offshore wind.
Tyre and Brake Emissions
Electric cars are heavier, producing more non-exhaust particulates (PM2.5) from tyres and brakes.
However:
- Regenerative braking reduces wear by 30–50%.
- Low-rolling-resistance tyres offset some particulate output.Overall difference vs petrol cars: <5 g/km CO₂ equivalent.
Government Incentives for Low Emission Vehicles
All BEVs qualify for:
- Zero Vehicle Excise Duty (VED) until April 2026.
- ULEZ and CAZ exemption.
- Reduced company car tax (2%) through 2025.
Further details: UK Speed Camera and ULEZ Regulations 2025
Manufacturer Emission Targets (2025–2030)
| Brand | 2025 Fleet Target (g/km) | Compliance |
|---|---|---|
| Tesla | 0 | ✅ |
| BMW | 75 | ✅ |
| Toyota | 95 | ✅ |
| Hyundai | 90 | ✅ |
| Volkswagen | 100 | ⚠ Borderline |
| Ford | 105 | ⚠ Borderline |
Manufacturers missing targets pay EU-aligned fines of €95 per g/km over limit per car sold.
Real-World Drivers’ Experience
From my point of view, EVs remain the most efficient daily solution in the UK if charged intelligently.
Drivers combining home solar charging with moderate mileage achieve under 40 g/km real CO₂ equivalent, outperforming any petrol or diesel.
In cold climates, winter range drop of 10–15% slightly raises per-mile CO₂, but still stays well below ICE averages.
Environmental Myths Corrected
| Claim | Reality |
|---|---|
| “EVs are worse for the planet” | False — lower total CO₂ after ~25,000 miles |
| “Battery disposal is toxic” | Mostly recycled; lithium recovery over 90% |
| “Electricity still comes from coal” | Coal < 1% of UK generation in 2025 |
| “EV tyres pollute more” | Negligible overall impact due to regen braking |
Expert Opinion
From my point of view, EV emissions are not “zero,” but they are dramatically lower than internal combustion across every measurable factor.
In the UK, the carbon payback arrives within two years of normal use, making electric cars the most sustainable mass-market option available today.
FAQs
Do electric cars produce CO₂?
Indirectly, yes — during battery production and electricity generation.
Are EVs still cleaner than hybrids?
Yes. Even with grid charging, they emit 30–40% less CO₂ over time.
What’s the cleanest way to charge an EV?
At home using renewable electricity tariffs.
Do EV batteries offset their emissions over time?
Yes, usually after 20,000–25,000 miles of use.
Will electric cars ever be completely carbon-neutral?
Only when manufacturing and charging use fully renewable energy.
In 2025, electric cars represent a genuine long-term CO₂ reduction path for UK drivers.
In my experience, choosing renewable charging, smaller batteries, and high mileage use maximises both environmental and economic benefit — proving that “zero emissions” is not a slogan, but an achievable goal.