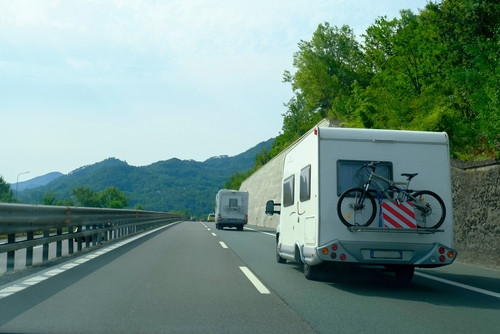
Highway driving accounts for most long-distance fuel use, but poor habits can double your consumption. Smart driving techniques, proper vehicle maintenance, and strategic planning reduce highway fuel consumption by 15-25%. This guide shows you how to save money on every highway journey.
Key takeaways: Maintain steady speed using cruise control at 60-65mph optimal, reduce air conditioning use as open windows create more drag at highway speeds, check tyre pressure regularly improving economy by 3%, remove unnecessary weight and roof boxes when not needed, use highest gear possible, plan routes avoiding traffic and hills, smooth acceleration saves 10%, coasting to stops saves fuel.
Maintain Steady Speed Using Cruise Control
Maintain steady speed by using cruise control to prevent unnecessary acceleration and braking. The optimal speed for fuel efficiency is 60-65 mph. This simple habit reduces consumption by 10-15% compared to aggressive driving.
Why Steady Speed Saves Fuel
Acceleration consumes fuel:
- Rapid acceleration: Engine uses maximum fuel to increase speed quickly
- Braking wastes energy: Kinetic energy converted to heat, lost completely
- Repeat cycle: Accelerating and braking repeatedly wastes significant fuel
- Steady speed: Engine runs at consistent, efficient output
Cruise control benefits:
- Prevents speed fluctuations: Maintains exact speed without human error
- Optimises engine load: Keeps engine in most efficient operating range
- Reduces fuel consumption: 10-15% savings on highway journeys
- Less driver fatigue: Automatic speed control reduces stress
Optimal Highway Speed
Speed vs fuel consumption relationship:
| Speed | Fuel Consumption | 15,000 Miles Annual Cost (40mpg, £1.50/litre) |
|---|---|---|
| 50 mph | Baseline | £1,410 |
| 60 mph | +5% | £1,480 |
| 65 mph | +8% | £1,523 |
| 70 mph | +12% | £1,580 |
| 75 mph | +18% | £1,664 |
| 80 mph | +25% | £1,763 |
60-65 mph is the sweet spot:
- Legal compliance: Within 70 mph limit
- Time efficient: Reasonable journey times
- Fuel efficient: Minimal consumption increase
- Safe driving: Comfortable speed for most conditions
At 70 mph, consumption increases 12% compared to 60 mph. Over 15,000 miles annually, this costs £80 extra per year.
Reduce Air Conditioning Use at Highway Speeds
Reduce air conditioning use as at highway speeds opening windows creates more drag than using AC. Use AC at medium settings instead of maximum.
AC vs Open Windows Calculation
The drag comparison depends on speed:
| Speed | Open Windows Drag | AC Consumption | Better Option |
|---|---|---|---|
| Under 40 mph | Minimal | 15-20% consumption | Open windows |
| 40-50 mph | Similar | 12-15% consumption | Similar |
| Over 50 mph | 10-15% drag | 12-15% consumption | Closed windows + AC |
| Highway 70 mph | 15-20% drag | 12-15% consumption | Closed windows + AC |
At 70 mph, open windows increase consumption by 15-20%, which exceeds or equals AC consumption. Closed windows with AC is actually more efficient.
How to Use AC Efficiently
Pre-cool before driving:
- Open windows for 2-3 minutes before starting
- Expel hot air naturally
- Reduce AC workload
- Save 3-5% fuel
Use medium settings:
- Set temperature to 22°C, not 16°C
- Medium fan speed, not maximum
- Reduces consumption by 5-8%
- Comfortable enough for most drivers
Turn off before arrival:
- Switch off AC 2-3 minutes before destination
- Keep fan running to dry system
- Prevents mould, maintains efficiency
- Saves 3-5% fuel
Check Tyre Pressure Regularly
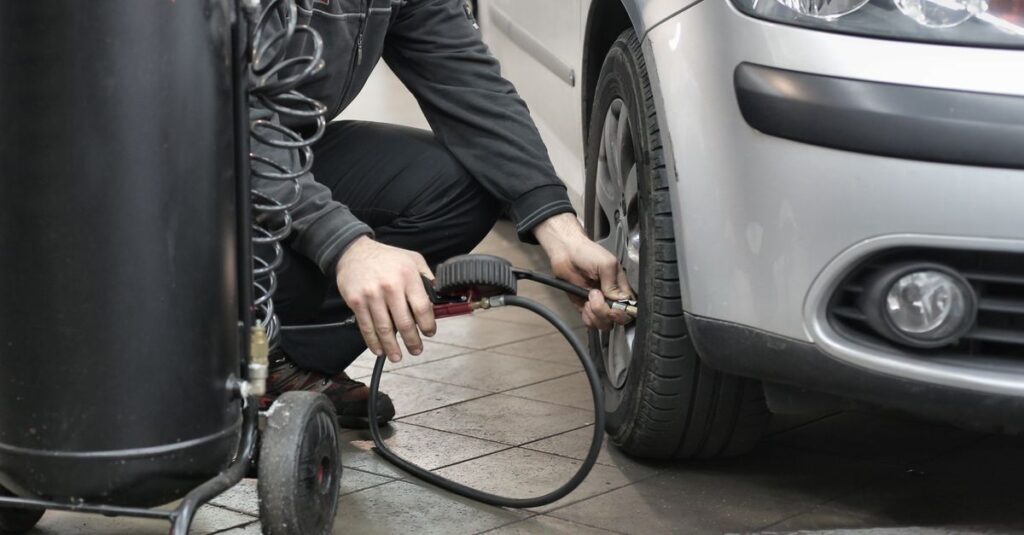
Check tyre pressure as correct pressure reduces rolling resistance and improves fuel economy by up to 3%.Underinflated tyres increase fuel consumption significantly.
Tyre Pressure Impact on Fuel
Pressure vs consumption relationship:
| Pressure Condition | Fuel Impact | Annual Cost (15,000 miles, 40mpg) |
|---|---|---|
| Correct pressure | Baseline | £1,410 |
| 10% underinflated | +3% | £1,452 |
| 20% underinflated | +6% | £1,495 |
| 30% underinflated | +10% | £1,551 |
3% improvement is significant:
- Annual savings: £42 per year at 15,000 miles
- Lifetime savings: £200+ over 5-year tyre life
- Easy action: 5-minute check monthly
- No cost: Free with own gauge
How to Check Tyre Pressure
Check when tyres are cold:
- Before driving or after 3+ hours parked
- Hot tyres show false high readings
- Cold readings reflect true pressure
- Adjust to manufacturer’s recommended levels
Where to find recommended pressure:
- Sticker inside driver’s door frame
- Inside fuel filler cap
- Vehicle handbook
- Manufacturer website
Use quality gauge:
- Digital gauges: Most accurate (£10-£20)
- Dial gauges: Accurate and reliable (£8-£15)
- Pen gauges: Less accurate, avoid (£3-£5)
Remove Unnecessary Weight and Roof Boxes
Remove unnecessary weight as extra load increases consumption. Remove roof boxes and bike racks when not needed. Every 100kg extra weight increases fuel consumption by 3-5%.
Weight Impact on Fuel
Load vs consumption relationship:
| Extra Weight | Fuel Impact | Annual Cost (15,000 miles, 40mpg) |
|---|---|---|
| No extra load | Baseline | £1,410 |
| 100kg (5 people + luggage) | +3% | £1,452 |
| 200kg (full load) | +6% | £1,495 |
| 300kg (towing + load) | +10% | £1,551 |
Roof Box Consumption Impact
A car roof box increases fuel consumption by 15-25% depending on:
- Size of the box
- Driving speed
- Vehicle type
- Weather conditions
At 70 mph, consumption can increase by up to 25% compared to driving without a roof box.
Roof box cost calculation:
- Without box: 15,000 miles ÷ 40 mpg = 375 gallons
- With box: 375 × 1.25 = 469 gallons
- Extra fuel: 94 gallons = £141 per year
- Annual cost: £141 for occasional use
Tips to minimise roof box consumption:
- Remove when not needed
- Drive at 60-65 mph optimal
- Ensure proper fitting and streamlining
- Pack evenly for balanced vehicle
Bike Rack Impact
Bike racks increase fuel consumption by 10-15% depending on size and number of bikes.
Bike rack cost:
- Without rack: 375 gallons annually
- With rack: 375 × 1.15 = 431 gallons
- Extra fuel: 56 gallons = £84 per year
Remove bike racks when not transporting bikes to save £84 annually.
Use the Right Gear
Use the right gear as automatic cars should stay in highest possible gear. Manual cars should upshift promptly. Proper gear selection reduces consumption by 5-10%.
Automatic Cars
Let automatic transmission select gear:
- Don’t use manual mode unless necessary
- Transmission optimises for fuel efficiency
- Hold accelerator steady to encourage upshifting
- Use eco mode if available for best efficiency
When to use manual mode:
- Towing heavy loads
- Driving in mountainous areas
- Need engine braking downhill
- Specific performance requirements
Manual Cars
Upshift promptly for best efficiency:
- Shift at 2,000-2,500 rpm: Optimal efficiency point
- Don’t lag in low gear: Wastes fuel unnecessarily
- Use highest gear: 6th gear at 60 mph, not 5th
- Smooth shifts: Prevent unnecessary acceleration
Gear selection by speed:
| Speed | Recommended Gear | RPM |
|---|---|---|
| 30 mph | 3rd | 1,800 |
| 40 mph | 4th | 2,000 |
| 50 mph | 5th | 2,200 |
| 60 mph | 6th | 2,400 |
| 70 mph | 6th | 2,800 |
Shifting at 2,500 rpm saves 5-8% compared to 3,500 rpm.
Plan Routes Avoiding Traffic and Hills
Plan your route to avoid traffic jams and steep hills where possible. Use apps that suggest fuel-efficient routes. Poor route choices increase consumption by 10-20%.
Traffic Impact on Fuel
Traffic congestion wastes fuel:
- Idling: Engine burns fuel while stationary (0.5-1 litre/hour)
- Acceleration: Repeated stopping and starting uses maximum fuel
- Low speed: Engine inefficient at slow speeds
- Total impact: 15-25% increase in congested traffic
Avoid traffic by:
- Check before departure: Use Google Maps or Waze
- Time journeys: Avoid 7-9 AM and 4-7 PM peaks
- Alternative routes: Plan 2-3 route options
- Real-time updates: Apps show current traffic conditions
Hill Impact on Fuel
Steep hills increase consumption:
- Going uphill: Engine works harder, uses 20-40% more fuel
- Going downhill: Recuperation in hybrids/EVs, but petrol cars waste kinetic energy
- Total effect: Mountain routes use 15-25% more fuel
Plan routes to minimise hills:
- Use route planners: Select “avoid hills” option
- Choose flat roads: A-roads often more level than mountain roads
- Accept longer distance: Flat 100 miles vs hilly 80 miles
- Calculate savings: Flat route saves 15% despite extra distance
Use Fuel-Efficient Route Apps
Apps that suggest fuel-efficient routes:
- Google Maps: “Avoid highways” option reduces consumption
- Waze: Real-time traffic, optimal routing
- ABetterRoutePlanner: EV-specific efficiency planning
- Fuelio: Track and analyse consumption by route
Smooth Acceleration Saves 10%
Smooth acceleration saves 10% compared to aggressive driving. Gradual speed increases keep engine in efficient operating range.
Aggressive vs Smooth Driving
Aggressive driving characteristics:
- Rapid acceleration: Floor accelerator, 0-60 mph in 6 seconds
- Hard braking: Slam brakes at stops
- Speed fluctuations: Constant acceleration and deceleration
- Fuel impact: 15-25% increase
Smooth driving characteristics:
- Gradual acceleration: Moderate throttle, 0-60 mph in 12 seconds
- Coasting braking: Release accelerator early, brake gently
- Steady speed: Minimal speed changes
- Fuel savings: 10-15% reduction
How to Drive Smoothly
Acceleration technique:
- Press accelerator gently: 25-50% throttle, not full
- Allow gradual speed increase: 5-10 seconds to reach target speed
- Maintain steady pressure: Hold throttle once at speed
- Avoid jerky movements: Smooth inputs throughout
Braking technique:
- Look ahead: See stops early, plan accordingly
- Release accelerator early: Start coasting 100-200m before stop
- Brake gently: Gradual pressure, not slamming
- Come to smooth stop: No jerky final brake
Speed maintenance:
- Use cruise control: Automatic steady speed
- Hold accelerator steady: Minimal throttle adjustments
- Accept speed variations: Don’t chase exact speed
- Anticipate traffic: Adjust early, not suddenly
Coasting to Stops Saves Fuel
Coasting to stops saves fuel by using momentum instead of engine power. Release accelerator early and let car slow naturally before braking.
How Coasting Works
Coasting technique:
- See stop ahead: Traffic light, junction, roundabout
- Release accelerator early: 100-300m before stop
- Let car slow naturally: Momentum carries forward
- Brake gently at end: Minimal braking needed
- Save fuel: Engine cuts off or uses minimal fuel while coasting
Fuel savings:
- Coasting distance: 100-300m per stop
- Fuel saved: 0.05-0.1 litres per stop
- Daily savings: 10 stops = 0.5-1 litre
- Annual savings: 15,000 miles = 50-100 litres = £75-£150
When to Coast
Ideal coasting situations:
- Approaching traffic lights: See red light early, coast
- Junctions ahead: Plan stop, release early
- Roundabouts: Slow gradually, coast into entry
- Speed reductions: 70 to 60 mph, coast down
- Traffic ahead: See slowing cars, coast early
Coasting vs braking:
- Coasting: Engine off or minimal fuel, momentum used
- Braking: Engine working, fuel burned, kinetic energy wasted
- Difference: Coasting saves 50-70% fuel compared to braking
Additional Fuel-Saving Techniques
Use Eco Driving Mode
Activate eco driving mode which optimises throttle response, transmission behavior, and climate control for maximum efficiency. Saves 5-8% fuel.
Eco mode benefits:
- Reduced throttle sensitivity: Prevents aggressive acceleration
- Optimised transmission: Upshifts earlier, stays in high gear
- Limited climate power: Reduces AC consumption
- Efficiency display: Shows real-time fuel economy
Turn Off Engine When Stopped
Turn off engine when stopped for more than 1 minute. Idling burns 0.5-1 litre per hour.
When to turn off:
- Long traffic waits: 2+ minutes stationary
- Train crossings: Extended stops
- Road closures: Complete stops
- Parking: Before entering car park
Restart fuel cost: 0.05 litres to restart
Idling savings: 1 minute = 0.015 litres saved
Break point: Stop longer than 30 seconds, turn off
Maintain Vehicle Regularly
Regular maintenance improves efficiency by 5-10%:
- Oil changes: Fresh oil reduces friction
- Air filters: Clean filters improve airflow
- Spark plugs: New plugs ensure efficient combustion
- Tyre pressure: Correct pressure reduces rolling resistance
- Engine tune: Proper tuning optimises performance
Reduce Electrical Load
Minimise electrical accessories:
- Headlights: Use only when needed (dusk, rain, night)
- Interior lights: Turn off when not seating passengers
- Audio system: Moderate volume, less power
- Phone charging: Limit simultaneous device charging
- Climate fans: Medium speed, not maximum
Electrical load impact: 5-10% additional consumption at maximum
Annual Fuel Cost Savings Summary
Total potential savings by implementing all techniques:
| Technique | Fuel Savings | Annual Cost Saving (15,000 miles, 40mpg) |
|---|---|---|
| Steady speed 60-65mph | 10-15% | £141-£212 |
| Correct tyre pressure | 3% | £42 |
| Remove roof box | 15-25% (when used) | £141 (if used regularly) |
| Smooth acceleration | 10% | £141 |
| Coasting to stops | 5% | £71 |
| Eco mode | 5-8% | £71-£113 |
| Regular maintenance | 5-10% | £71-£141 |
| Total combined | 30-40% | £420-£560 |
Implementing these techniques saves £420-£560 annually at 15,000 miles. This is 30-40% of total fuel costs.
In my experience, highway fuel consumption is entirely controllable through driving habits. The single most important factor is maintaining steady speed at 60-65mph – this simple habit saves 10-15% immediately without any cost.
From my point of view, the most critical combination is steady speed + correct tyre pressure + smooth acceleration. These three techniques save 20-25% combined and require only behavioural changes, no equipment purchases.
I would recommend focusing on essentials first: use cruise control at 60-65mph, check tyre pressure monthly, accelerate smoothly, and coast to stops. These simple steps reduce highway fuel consumption by 25% and save £350+ annually.
For UK drivers, highway driving accounts for 60-70% of annual fuel use. Improving highway efficiency has the biggest impact on total fuel costs. With proper techniques, you can cut highway consumption by 30-40%, saving hundreds of pounds per year. For official vehicle efficiency information, visit gov.uk. For fuel cost comparisons, check AA Fuel Price Reporter. For industry statistics, visit SMMT.