Complete UK fuel consumption guide 2025: Calculate MPG, understand L/100km, real-world consumption factors, cost calculations, and improve your car’s fuel efficiency.
Understanding your vehicle’s fuel consumption has become crucial for UK drivers facing rising petrol and diesel prices, environmental concerns, and increasingly sophisticated vehicle technology. Whether you measure efficiency in traditional Miles Per Gallon (MPG), European litres per 100 kilometres (L/100km), or need to calculate real-world trip costs, accurate fuel consumption knowledge helps budget for travel expenses, monitor vehicle health, and make informed decisions about driving habits and vehicle purchases. From basic calculation methods to factors affecting consumption, this comprehensive guide provides everything UK motorists need to understand how much their car really drinks.
Key Takeaways:
- ✓ UK uses Imperial MPG (different from US MPG): 40 UK MPG = 7.06 L/100km
- ✓ Real-world consumption often 10-20% higher than official manufacturer figures
- ✓ Simple calculation: Distance ÷ Fuel Used = MPG (miles ÷ gallons)
- ✓ Driving style, weather, and vehicle condition significantly affect fuel consumption
- ✓ Regular monitoring helps identify vehicle problems and optimize efficiency
Understanding UK Fuel Consumption Measurements
Fuel consumption measurement in the UK involves multiple systems that can confuse drivers trying to understand their vehicle’s efficiency. In my experience helping UK motorists understand fuel economics, the persistence of Imperial measurements alongside European standards creates complexity that requires clear explanation.
Imperial MPG (UK Standard): The UK uses Imperial Miles Per Gallon, where one Imperial gallon equals 4.546 litres. This differs significantly from US measurements, making direct comparisons challenging without conversion.
Imperial vs US Gallon Difference:
- UK Imperial Gallon: 4.546 litres
- US Gallon: 3.785 litres
- Impact: UK MPG figures appear approximately 20% higher than equivalent US MPG
European L/100km System: Modern vehicles often display consumption in litres per 100 kilometres, following European standards. This “lower is better” system contrasts with MPG’s “higher is better” approach.
Conversion Formulas:
- UK MPG to L/100km: 282.48 ÷ MPG = L/100km
- L/100km to UK MPG: 282.48 ÷ L/100km = MPG
- UK MPG to US MPG: UK MPG ÷ 1.201 = US MPG
From my point of view, understanding these measurement differences prevents confusion when comparing vehicles, reading international reviews, or using foreign fuel economy data.
WLTP vs Real-World Consumption: Official Worldwide Harmonised Light Vehicles Test Procedure (WLTP) figures provide standardised comparisons but may not reflect real-world driving conditions. Actual consumption typically runs 10-20% higher than WLTP ratings due to:
- Traffic conditions and driving style variations
- Weather impacts on engine efficiency
- Vehicle loading and passenger weight
- Air conditioning and electrical system usage
For comprehensive guidance on vehicle systems that affect fuel consumption, our detailed guide to vehicle maintenanceprovides essential information about maintaining optimal efficiency.
How to Calculate Your Vehicle’s Fuel Consumption
Accurate fuel consumption calculation requires systematic measurement over representative driving periods to establish meaningful baseline figures for comparison and improvement.
Basic MPG Calculation Method
Step-by-Step Procedure:
- Fill Tank Completely: Top up fuel tank until pump clicks off automatically
- Reset Trip Meter: Zero odometer or note current mileage reading
- Drive Normally: Maintain typical driving patterns for representative period
- Refill Tank: Return to same petrol station, fill completely using same pump if possible
- Record Data: Note miles driven and fuel quantity added
Calculation Formula: MPG = Miles Driven ÷ Gallons of Fuel Used
Example Calculation:
- Miles driven: 300 miles
- Fuel used: 8.5 gallons
- MPG = 300 ÷ 8.5 = 35.3 MPG
L/100km Calculation Method
For drivers preferring metric measurements:
Formula: L/100km = (Litres Used ÷ Kilometres Driven) × 100
Example Calculation:
- Kilometres driven: 483 km (300 miles)
- Fuel used: 32.2 litres (8.5 gallons)
- L/100km = (32.2 ÷ 483) × 100 = 6.67 L/100km
Digital vs Manual Monitoring
Trip Computer Advantages:
- Real-Time Data: Instant consumption feedback
- Average Calculations: Automatic computation over set periods
- Reset Functions: Easy measurement period establishment
- Multiple Displays: Various measurement units available
Manual Calculation Benefits:
- Accuracy Verification: Cross-checking digital systems
- Long-Term Trends: Historical data collection
- Problem Detection: Identifying consumption changes indicating issues
- Cost Awareness: Direct relationship between fuel usage and expenses
Recommended Approach: Use both methods concurrently – trip computer for immediate feedback and manual calculation for accurate long-term monitoring and verification.
Factors Affecting Measurement Accuracy
Fuel Station Variables:
- Pump Consistency: Different pumps may vary in auto-shutoff points
- Temperature Effects: Fuel density changes with temperature
- Station Differences: Pump calibration variations
- Fill Technique: Consistency in filling method affects accuracy
Driving Period Considerations:
- Minimum Distance: At least 300 miles for meaningful average
- Representative Conditions: Include typical mix of urban, rural, and motorway driving
- Seasonal Variations: Account for weather-related consumption changes
- Load Consistency: Maintain similar passenger and cargo loading
Real-World vs Official Consumption Figures
Understanding the relationship between manufacturer-quoted fuel consumption figures and real-world performance helps set realistic expectations and identify potential vehicle issues.
WLTP Testing Limitations
Laboratory Conditions:
- Controlled Environment: Standard temperature, humidity, and atmospheric pressure
- Test Route: Predetermined cycle with specific acceleration and deceleration patterns
- Vehicle Preparation: Optimal tire pressures, minimal electrical load, lightweight test conditions
- Driver Technique: Consistent, efficiency-optimized driving patterns
Real-World Variables:
- Traffic Conditions: Stop-start urban driving vs smooth laboratory cycles
- Weather Impact: Wind resistance, temperature extremes, precipitation effects
- Individual Driving Style: Acceleration patterns, speed choices, route selection
- Vehicle Loading: Passengers, cargo, roof equipment affecting aerodynamics and weight
Typical Consumption Variations
Urban Driving (City/Town):
- WLTP vs Reality: Often 15-25% higher consumption than official figures
- Contributing Factors: Frequent stops, idling, cold starts, traffic congestion
- Efficiency Range: 20-40 MPG typical for average petrol cars
- Improvement Potential: Significant gains possible through driving technique changes
Motorway Driving:
- WLTP Alignment: Usually closer to official figures at steady speeds
- Optimal Speed Range: 50-65 mph typically most efficient
- High-Speed Penalties: Consumption increases dramatically above 70 mph
- Wind Impact: Headwinds can increase consumption by 10-15%
Combined Driving:
- Mixed Conditions: 55% urban, 45% motorway reflects typical UK usage patterns
- Realistic Expectations: 10-15% above WLTP figures for most vehicles
- Seasonal Variations: Winter consumption typically 5-15% higher than summer
- Vehicle Age Effects: Older vehicles may show greater deviation from original figures
Manufacturer vs Independent Testing
What Car? Real MPG: Independent testing often reveals significant differences from manufacturer claims:
- Testing Methodology: Standardized real-world route including urban, rural, and motorway sections
- Temperature Controlled: Testing at consistent 20°C ambient temperature
- Realistic Loading: Including driver, passenger, and typical cargo
- Multiple Runs: Average results from multiple test cycles
Honest John Real MPG: User-submitted data from actual owners provides extensive real-world database:
- Owner Reporting: Thousands of submissions for popular models
- Long-Term Averages: Data spanning multiple years and conditions
- Variation Ranges: Shows spread between best and worst achieving drivers
- Trend Analysis: Identifies models consistently over or under-achieving official figures
Factors Affecting Fuel Consumption
Numerous variables influence vehicle fuel consumption, with some under driver control and others related to vehicle condition, weather, or route characteristics.
Driving Style Impact
Acceleration Patterns:
- Gentle Acceleration: Smooth, progressive acceleration can improve consumption by 10-15%
- Harsh Acceleration: Rapid acceleration significantly increases fuel usage
- Optimal Technique: Accelerate briskly to desired speed, then maintain steady pace
- Traffic Light Strategy: Anticipate stops to minimize aggressive acceleration from rest
Speed Management:
- Optimal Speed Range: Most cars achieve best efficiency between 45-65 mph
- High-Speed Penalties: Consumption increases exponentially above 70 mph
- Urban Speed Control: Maintaining smooth 25-35 mph better than varying 20-40 mph
- Cruise Control Benefits: Consistent speeds improve highway efficiency
Braking and Deceleration:
- Anticipatory Driving: Reading traffic to minimize unnecessary braking
- Engine Braking: Using gear changes to slow vehicle reduces fuel usage
- Coasting Technique: Lifting off accelerator early for traffic lights and junctions
- Regenerative Braking: Hybrid vehicles recover energy through proper braking technique
Vehicle Condition Factors
Engine Health:
- Maintenance Impact: Well-maintained engines achieve better fuel economy
- Air Filter Condition: Dirty filters can increase consumption by 5-10%
- Oil Quality: Fresh, correct-grade oil reduces internal friction
- Spark Plug Condition: Worn plugs cause incomplete combustion
Tyre Factors:
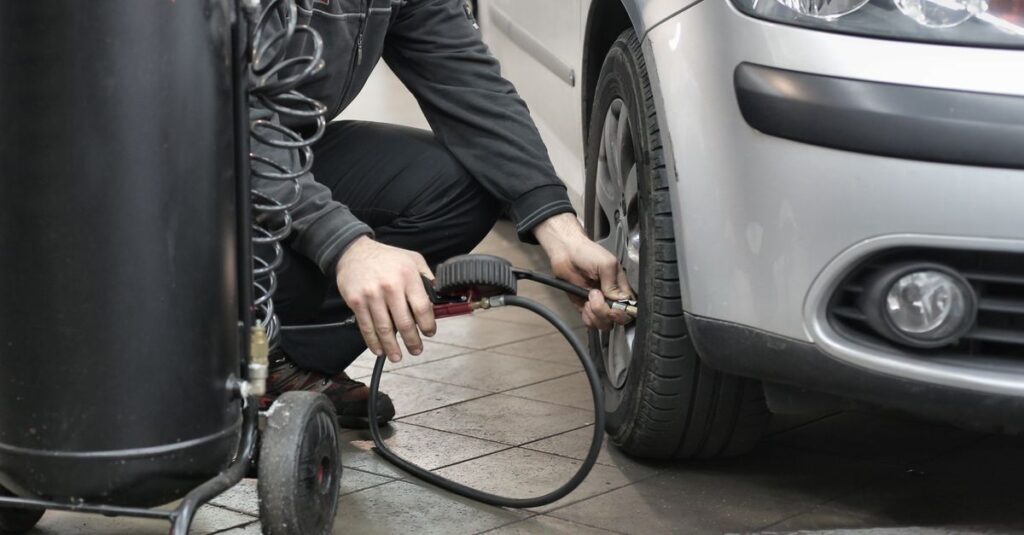
- Pressure Maintenance: Under-inflated tyres increase rolling resistance significantly
- Pressure Checking: Monthly checks prevent 2-4% consumption increases
- Tyre Type: Low rolling resistance tyres can improve efficiency by 2-3%
- Alignment Impact: Poor wheel alignment increases drag and tyre wear
Aerodynamic Considerations:
- Roof Equipment: Roof bars, boxes, bikes increase consumption by 5-15%
- Window Position: Open windows at high speed less efficient than air conditioning
- Vehicle Loading: Excess weight requires more energy to accelerate and climb hills
- Maintenance Items: Missing or damaged aerodynamic components affect efficiency
Environmental and Route Factors
Weather Conditions:
- Temperature Effects: Cold weather reduces efficiency through longer warm-up periods
- Wind Impact: Headwinds dramatically increase consumption, tailwinds improve it
- Rain and Snow: Wet conditions require more energy for traction and safety systems
- Air Density: High altitude reduces air density, affecting engine breathing
Route Characteristics:
- Elevation Changes: Hills and mountains significantly increase fuel usage
- Road Surface: Smooth tarmac vs rough surfaces affects rolling resistance
- Traffic Density: Stop-start traffic dramatically reduces efficiency
- Journey Length: Short trips prevent engines reaching optimal operating temperature
Urban vs Rural Efficiency:
- City Driving: Frequent stops, lower speeds, traffic congestion reduce efficiency
- Rural Roads: Steady speeds and fewer stops generally improve consumption
- Motorway Travel: High speeds increase consumption despite steady pace
- Mixed Routes: Combination driving typically produces moderate efficiency figures
For detailed information about maintaining vehicle systems that affect fuel efficiency, our comprehensive guide to UK vehicle maintenance provides essential maintenance information.
Cost Calculation and Budgeting
Understanding the financial implications of fuel consumption helps drivers budget accurately for travel expenses and make informed decisions about journey planning and vehicle usage.
Per-Mile Cost Calculation
Basic Formula: Cost per mile = (Fuel Price per Litre × Consumption in L/100km) ÷ 100 × 0.621371
Simplified UK Calculation: Pence per mile = (Pence per Litre ÷ MPG) × 4.546
Example Calculation:
- Fuel price: 145p per litre
- Vehicle consumption: 40 MPG
- Cost per mile = (145 ÷ 40) × 4.546 = 16.5p per mile
Journey Cost Estimation
Trip Planning Formula: Journey Cost = Distance ÷ MPG × Fuel Price per Gallon
Practical Example:
- Journey distance: 250 miles
- Vehicle efficiency: 45 MPG
- Petrol price: £1.45 per litre (£6.60 per gallon)
- Fuel cost = 250 ÷ 45 × £6.60 = £36.67
Annual Fuel Budget Calculation
Yearly Consumption Estimate:
- Calculate Annual Mileage: Track monthly driving or estimate typical usage
- Determine Average Efficiency: Use long-term consumption monitoring
- Apply Current Fuel Prices: Account for seasonal price variations
- Include Price Inflation: Consider likely price changes during year
Budget Example:
- Annual mileage: 12,000 miles
- Average consumption: 42 MPG
- Fuel requirement: 12,000 ÷ 42 = 286 gallons
- At £6.60 per gallon = £1,888 annual fuel cost
Comparison Shopping Benefits
Vehicle Purchase Decisions:
- Efficiency Comparison: Calculate annual fuel cost differences between models
- Break-Even Analysis: When higher purchase price justified by fuel savings
- Total Cost of Ownership: Include depreciation, insurance, maintenance alongside fuel costs
- Usage Pattern Matching: Choose vehicle efficiency suited to typical driving patterns
Route Planning Economics:
- Distance vs Time: Longer routes may offer better fuel efficiency
- Toll Road Analysis: Fuel savings vs toll charges on faster routes
- Multi-Stop Optimization: Planning routes to minimize total fuel consumption
- Alternative Transport: When public transport becomes more economical
Improving Fuel Efficiency: Practical Strategies
Implementing proven techniques to improve fuel consumption can result in significant savings while reducing environmental impact and extending vehicle range.
Driving Technique Optimization
Eco-Driving Principles:
- Smooth Acceleration: Gradual speed increases reduce fuel consumption by 10-15%
- Anticipatory Driving: Reading traffic ahead to minimize unnecessary speed changes
- Optimal Speed Maintenance: Staying within 45-65 mph range for maximum efficiency
- Hill Climbing Strategy: Maintain momentum approaching hills rather than accelerating on gradients
Traffic Management:
- Gap Maintenance: Sufficient following distance enables smooth speed adjustments
- Traffic Light Timing: Adjusting approach speed to minimize stops
- Lane Selection: Choosing lanes with steadier traffic flow
- Rush Hour Avoidance: Alternative timing when possible to avoid stop-start conditions
Technology Utilization:
- Cruise Control: Maintaining steady speeds on motorways and dual carriageways
- Eco Modes: Using manufacturer efficiency settings where available
- Trip Computer Monitoring: Real-time feedback to optimize driving technique
- Navigation Systems: Route selection to avoid congestion and minimize distance
Vehicle Maintenance for Efficiency
Regular Service Items:
- Engine Oil: Fresh oil reduces internal friction and improves efficiency
- Air Filter Replacement: Clean filters optimize air-fuel mixture
- Spark Plug Condition: Efficient combustion requires properly functioning ignition
- Fuel System Cleaning: Maintaining clean injectors and fuel system components
Tyre Management:
- Pressure Monitoring: Weekly checks prevent efficiency losses from under-inflation
- Pressure Optimization: Some drivers increase pressure slightly above manufacturer recommendations
- Tyre Selection: Low rolling resistance tyres can improve efficiency by 2-3%
- Rotation Schedule: Even wear patterns maintain optimal contact patch
Weight and Aerodynamics:
- Unnecessary Item Removal: Reducing vehicle weight improves acceleration efficiency
- Roof Equipment: Removing unused roof bars, boxes, and bike carriers
- Boot Clearance: Avoiding carrying unnecessary items
- Aerodynamic Aids: Some aftermarket products may improve efficiency marginally
Journey Planning and Route Optimization
Strategic Planning:
- Route Selection: Choosing roads with steady traffic flow over shorter but congested alternatives
- Time Management: Traveling during off-peak periods when possible
- Multi-Purpose Trips: Combining errands to reduce cold-start penalties
- Seasonal Adjustments: Modifying routes and timing for weather conditions
Technology Integration:
- Traffic Apps: Real-time traffic information for route optimization
- Fuel Price Comparison: Apps showing cheapest local fuel prices
- Journey Combining: Planning to minimize total travel requirements
- Alternative Transport: Evaluating when public transport becomes more efficient
Monitoring and Tracking Consumption
Systematic monitoring of fuel consumption provides valuable insights into vehicle health, driving efficiency, and cost management while identifying opportunities for improvement.
Record Keeping Systems
Manual Logging:
- Fuel Purchase Records: Date, location, price, quantity, odometer reading
- Calculation Frequency: Monthly or quarterly consumption analysis
- Trend Identification: Spotting gradual changes indicating developing problems
- Cost Tracking: Understanding spending patterns and budget impact
Digital Solutions:
- Smartphone Apps: Fuel tracking applications with calculation and analysis features
- Spreadsheet Systems: Custom tracking with personalized categories and calculations
- Vehicle Integration: Some modern cars store consumption data accessible via infotainment
- Cloud Backup: Ensuring data preservation and multi-device access
Analysis and Interpretation
Trend Recognition:
- Seasonal Patterns: Understanding normal winter/summer consumption variations
- Gradual Changes: Identifying slow degradation suggesting maintenance needs
- Sudden Changes: Recognizing problems requiring immediate attention
- Comparative Analysis: Comparing different vehicles, routes, or driving conditions
Problem Diagnosis:
- Consumption Increases: Potential engine, transmission, or aerodynamic issues
- Efficiency Drops: Maintenance needs or driving pattern changes
- Irregular Patterns: Intermittent problems requiring investigation
- Benchmarking: Comparing against similar vehicles and typical figures
Performance Optimization
Improvement Tracking:
- Technique Changes: Measuring impact of driving style modifications
- Maintenance Benefits: Quantifying efficiency gains from servicing
- Route Optimization: Comparing different journey options
- Vehicle Modifications: Assessing effectiveness of efficiency improvements
Goal Setting:
- Efficiency Targets: Establishing realistic improvement objectives
- Cost Reduction Goals: Setting annual fuel budget targets
- Environmental Impact: Tracking carbon footprint reductions
- Competition Elements: Family or workplace efficiency challenges
For comprehensive guidance on vehicle systems that support efficient operation, our detailed guide to UK speed camera compliance covers related automotive technology and legal requirements.
Frequently Asked Questions
How do I calculate my car’s MPG accurately?
Fill your tank completely, reset your trip meter to zero, drive normally for at least 300 miles, then fill up again at the same petrol station using the same pump if possible. Divide the miles driven by the gallons of fuel added: MPG = Miles ÷ Gallons. For example, 400 miles ÷ 10 gallons = 40 MPG. Use the same filling technique each time for consistency, and avoid calculating over very short distances as this reduces accuracy. Modern trip computers provide instant readings, but manual calculation over longer periods gives more accurate long-term averages.
What’s the difference between UK MPG and the L/100km shown on my dashboard?
UK MPG (Miles Per Imperial Gallon) and L/100km (Litres per 100 kilometres) are different measurement systems. Higher MPG means better efficiency, while lower L/100km means better efficiency. To convert: L/100km = 282.48 ÷ UK MPG. For example, 40 UK MPG equals 7.06 L/100km. The UK still primarily uses MPG for fuel economy, while Europe uses L/100km. Your car’s display may show either depending on settings, but both measure the same thing – how efficiently your car uses fuel.
Why is my real-world fuel consumption different from the manufacturer’s figures?
Official WLTP (Worldwide Harmonised Light Vehicles Test Procedure) figures are measured under controlled laboratory conditions with optimal temperatures, standardized driving cycles, and minimal vehicle loading. Real-world driving involves traffic congestion, weather variations, individual driving styles, air conditioning use, and different road conditions. Actual consumption is typically 10-20% higher than official figures. Urban driving often shows the biggest difference due to stop-start traffic, while steady motorway driving may align more closely with official figures. This is normal and doesn’t indicate a problem with your vehicle.
What factors most affect my car’s fuel consumption?
The biggest factors are driving style (gentle acceleration vs aggressive driving can differ by 15%), speed (consumption increases dramatically above 70mph), vehicle maintenance (dirty air filters, low tyre pressure add 5-10%), weather conditions (cold weather and headwinds increase consumption significantly), and route type (urban stop-start vs steady motorway driving). Vehicle loading, using air conditioning, and carrying roof equipment also impact efficiency. Short journeys where the engine doesn’t reach optimal temperature are particularly inefficient. Regular maintenance and smooth driving techniques offer the most improvement potential.
How can I improve my car’s fuel efficiency?
Practice smooth driving: accelerate gently, maintain steady speeds between 45-65mph, anticipate traffic to minimize braking, and use cruise control on motorways. Keep your car well-maintained with regular services, correct tyre pressures (check monthly), clean air filters, and fresh engine oil. Remove unnecessary weight and roof equipment when not needed. Plan journeys to avoid peak traffic, combine trips to reduce cold starts, and consider alternative routes with steadier traffic flow. Use air conditioning at high speeds instead of open windows, and avoid excessive idling. These techniques combined can improve efficiency by 10-20%.
What’s a good MPG figure for different types of cars?
Small petrol cars (city cars, superminis) typically achieve 45-60 MPG in mixed driving. Medium petrol cars (family hatchbacks, saloons) usually get 35-50 MPG. Large petrol cars and SUVs often achieve 25-40 MPG. Diesel cars generally achieve 10-20% better figures than petrol equivalents. Hybrid vehicles can exceed 60 MPG in urban conditions. Performance cars may only achieve 20-30 MPG. These are real-world figures – official manufacturer claims are typically 10-20% higher. Anything above 50 MPG is considered excellent for non-hybrid vehicles, while below 25 MPG suggests either a large/powerful vehicle or potential efficiency issues.
Should I use my trip computer or calculate MPG manually?
Use both methods for best results. Trip computers provide instant feedback useful for adjusting driving technique and monitoring short-term changes, but they can be optimistic and may not account for all fuel usage. Manual calculation over longer periods (300+ miles) gives more accurate long-term averages and helps verify trip computer accuracy. Manual calculation is essential for detecting gradual changes that might indicate developing problems. Many drivers find trip computers read 5-10% optimistically compared to manual calculations. For budgeting and serious efficiency monitoring, rely on manual calculations while using trip computer data for immediate driving feedback.
Conclusion: Mastering Your Vehicle’s Fuel Consumption
Understanding and managing fuel consumption effectively requires combining accurate measurement techniques with knowledge of factors affecting efficiency and practical strategies for improvement. In an era of fluctuating fuel prices and increasing environmental awareness, this knowledge provides both financial and environmental benefits while helping maintain optimal vehicle performance.
Key Success Strategies:
Systematic Monitoring: Regular, accurate measurement using both manual calculations and digital tools provides reliable baseline data for detecting changes and measuring improvements. The investment in systematic record-keeping pays dividends through early problem detection and efficiency optimization.
Realistic Expectations: Understanding that real-world consumption typically exceeds manufacturer figures by 10-20% prevents disappointment while highlighting vehicles that significantly over or under-perform expectations. This knowledge supports better vehicle purchase decisions and maintenance planning.
Holistic Approach: Fuel efficiency results from the interaction of driving technique, vehicle maintenance, route selection, and external factors. Success comes from addressing multiple factors simultaneously rather than focusing on single solutions.
Continuous Improvement: Small changes in driving technique, maintenance practices, and journey planning can compound to produce significant efficiency gains and cost savings over time.
The relationship between driving style and fuel consumption demonstrates how driver behavior significantly influences efficiency outcomes. Smooth, anticipatory driving techniques can improve consumption by 10-15% without sacrificing journey times or safety, making this one of the most cost-effective ways to reduce motoring expenses.
Vehicle maintenance plays an equally important role, with properly inflated tyres, clean air filters, and regular servicing maintaining optimal efficiency while preventing small problems from developing into expensive repairs. The correlation between vehicle health and fuel consumption makes efficiency monitoring a valuable diagnostic tool for identifying developing problems.
Modern technology, from smartphone apps to advanced trip computers, makes monitoring easier while providing real-time feedback that supports efficiency optimization. However, the fundamental principles of accurate measurement, systematic analysis, and informed improvement remain unchanged regardless of the tools used.
For UK drivers, understanding fuel consumption measurement and improvement provides immediate financial benefits while supporting broader environmental goals. Whether motivated by cost savings, environmental concerns, or simple curiosity about vehicle performance, the techniques and knowledge outlined in this guide provide practical tools for optimizing fuel efficiency in real-world driving conditions.
For additional guidance on vehicle systems that affect fuel efficiency, explore our comprehensive guides to UK toll road systems and vehicle warning systems that support optimal vehicle operation.